Help center · Tutorial · 8 steps
How to report project status: the quad chart, the health color, and saved status reports
- About 15 minutes
- Free plan and up (saved reports, earned value, and the calendar feed are on Pro)
- Checked in the app on
On Helikon, a project's status lives on its Reports tab. Every plan gets a live quad chart, the one-page summary sponsors and program managers expect, with a health color worked out from the project's own records. Every plan can print the chart and download the whole project as a CSV. On Pro, you also save a status report for each reporting period, approve it, keep the history, and export it as a PDF or a PowerPoint slide. Pro adds earned value for the project's owner and admins.
The quad chart is a federal format. NASA's Earth Science Technology Office asks each funded project for one within 15 days of award. It asks for an update at least once a year. Its four quadrants hold the objective, the approach and partners, a graphic, and the key milestones (NASA ESTO, InVEST-20 reporting requirements, section 7.1). DARPA publishes its own quad chart template for small-business proposals. Ours uses four standard quadrants, filled from the project as it stands today.
Before you start: you need to be a member of the project. Everyone on the project, on every plan, can open the Reports tab. Budget figures and earned value appear only for the project's owner and admins. The Pro features follow the project owner's plan, except the calendar feed in step 8, which follows your own.
Translation Box: "status report"
On the industry side: a status report is a short, regular snapshot for a program manager deciding where to put the next quarter's effort. It leads with health, the schedule, and the spend, often on one slide.
On the academic side: the familiar version is a progress report to a funder, usually once a year in the funder's own format, describing scientific progress. A sponsor reads a monthly or quarterly one-pager differently, so agree the cadence and the format at the kickoff meeting.
Step 1Open the Reports tab and read the quad chart
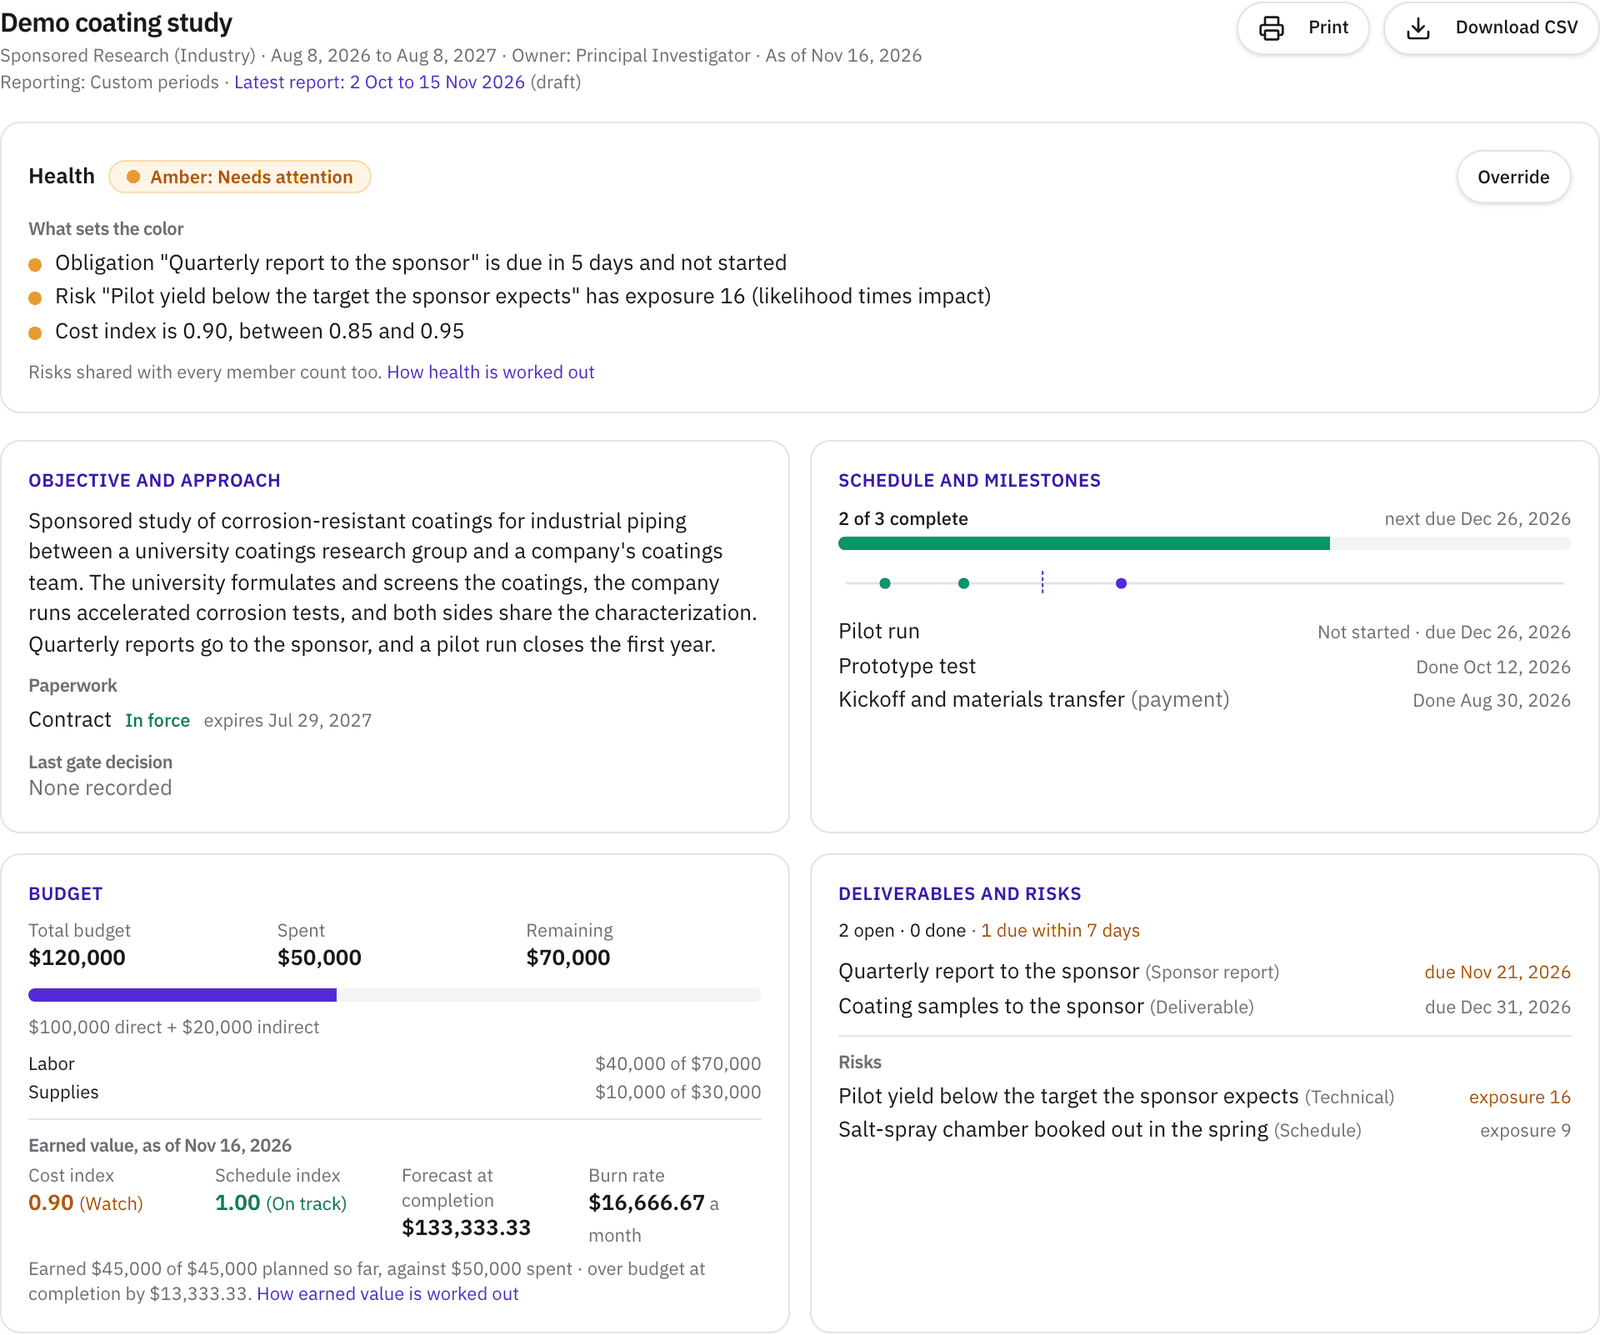
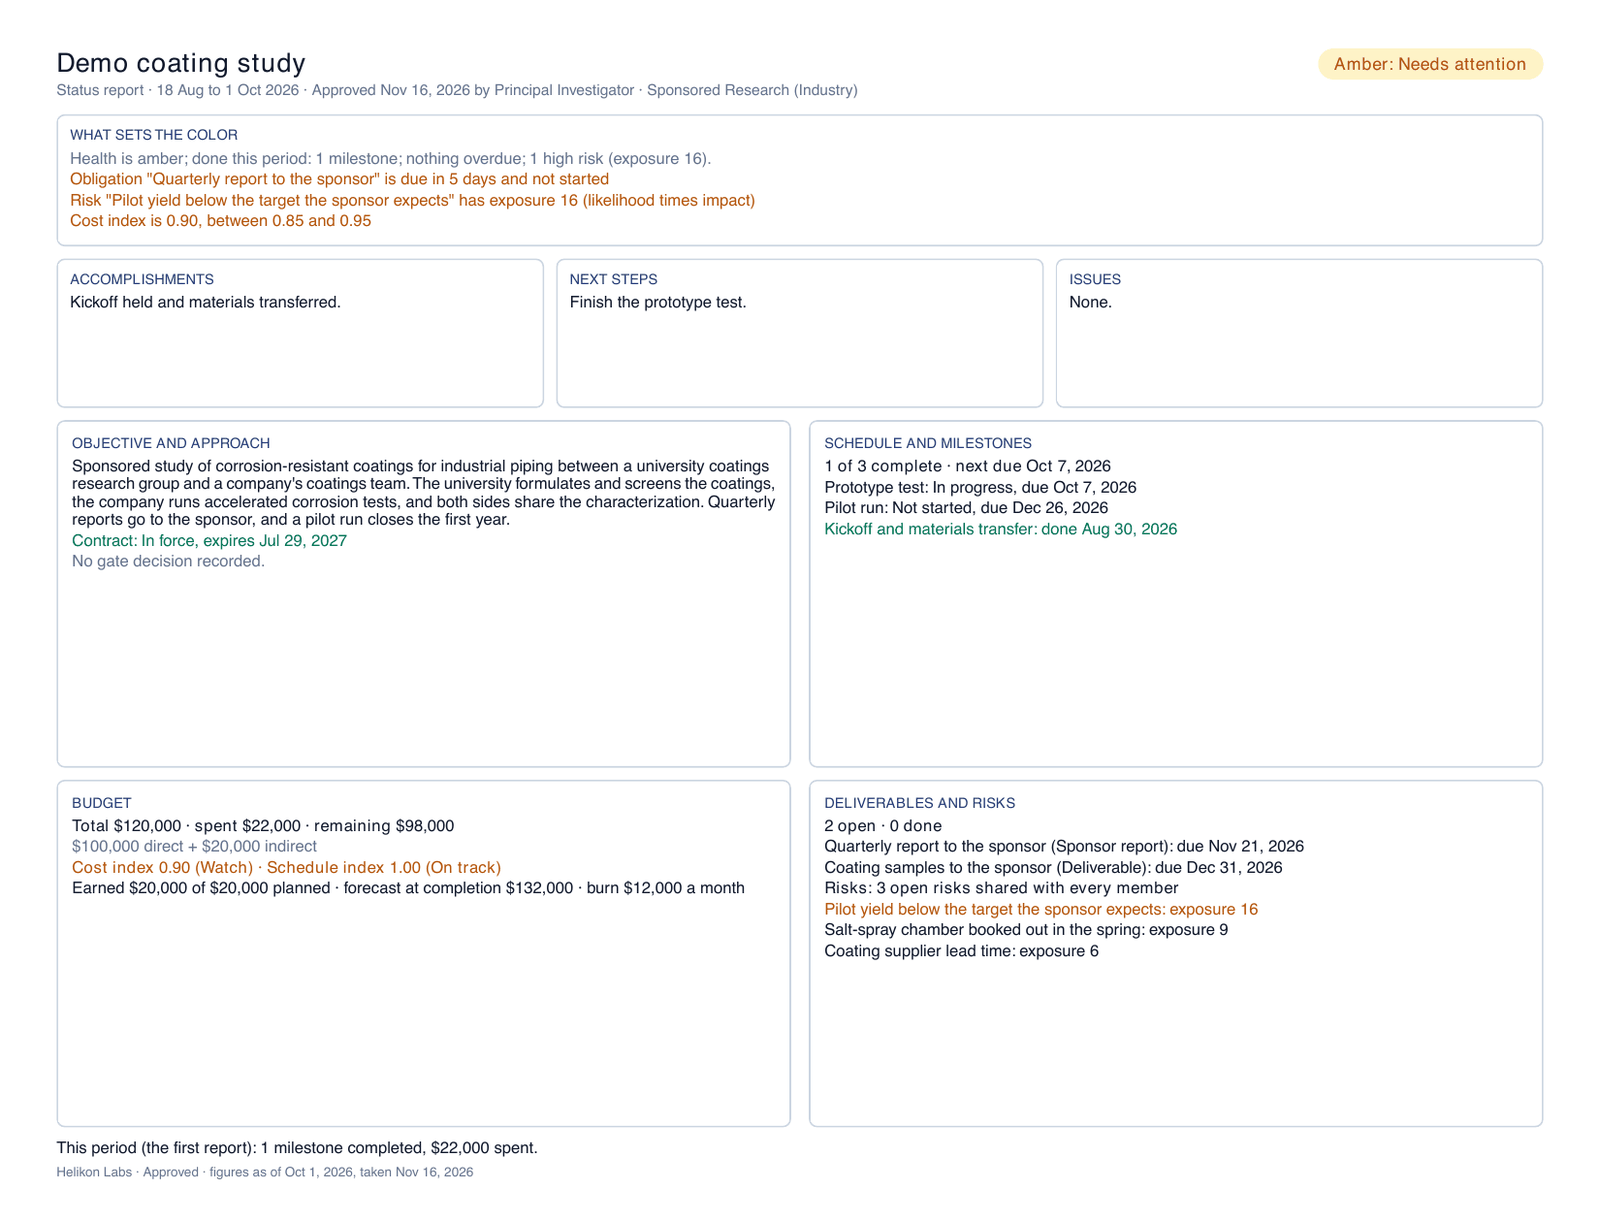
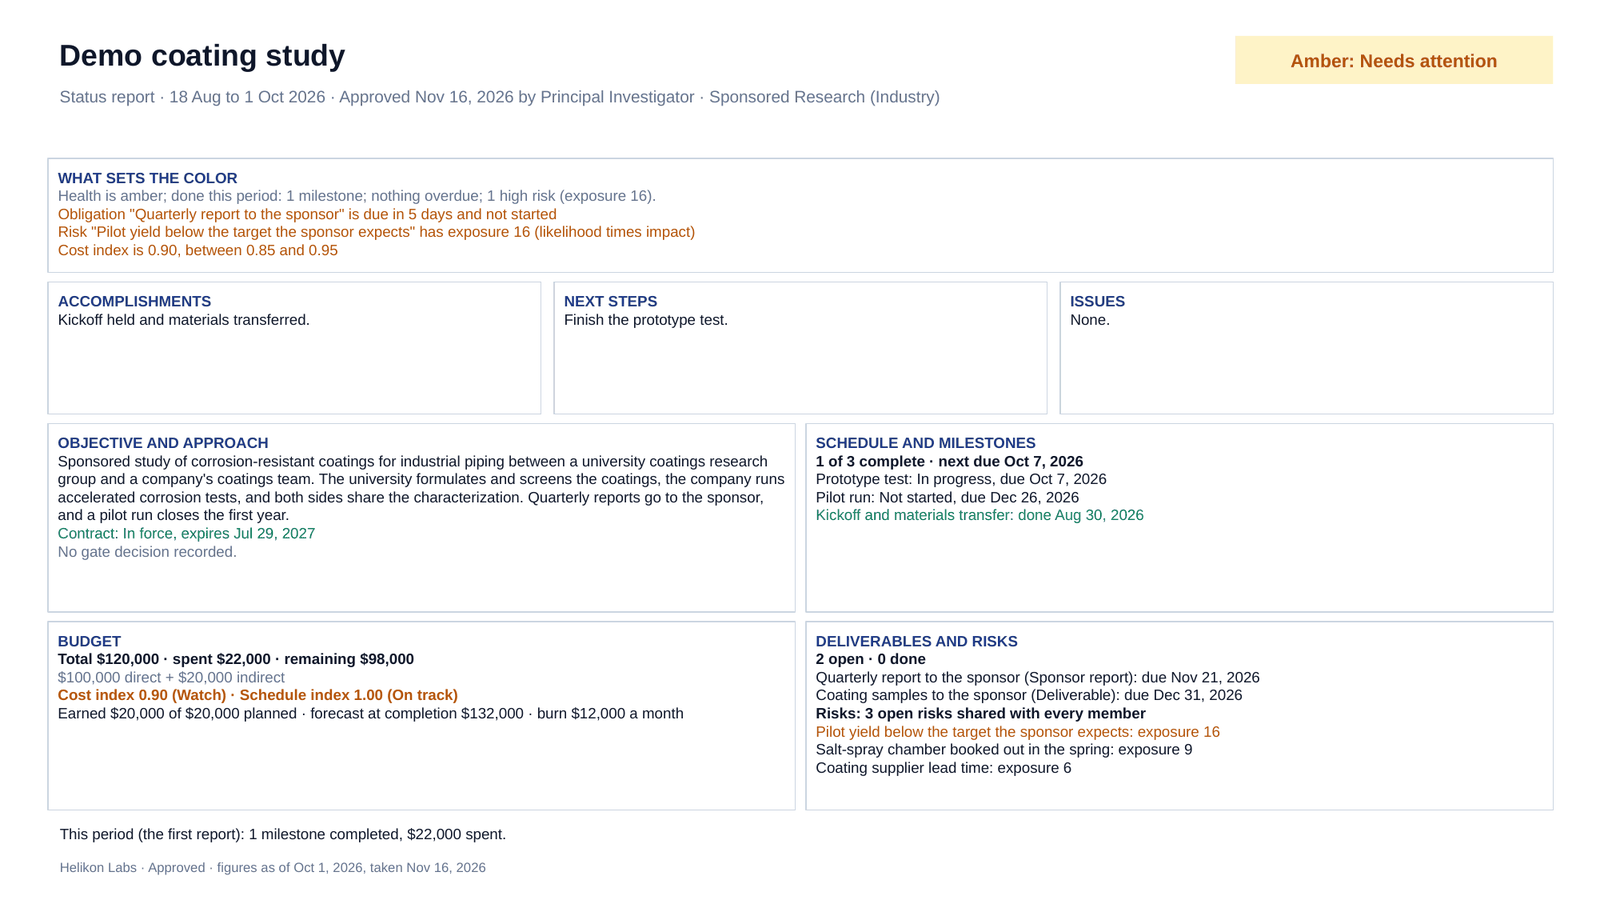
Open the project and click the Reports tab. The header gives the project's title, its collaboration type, its dates, its owner, and today's date. The chart has four quadrants:
- Objective and approach: the project description, each piece of paperwork the project requires (NDA, IRB approval, or contract) with its state, such as In force or Expires soon, and the last phase-gate decision.
- Schedule and milestones: how many milestones are complete, how many are overdue, what's due next, a strip showing every dated milestone across the project's dates with today marked, and the milestones themselves.
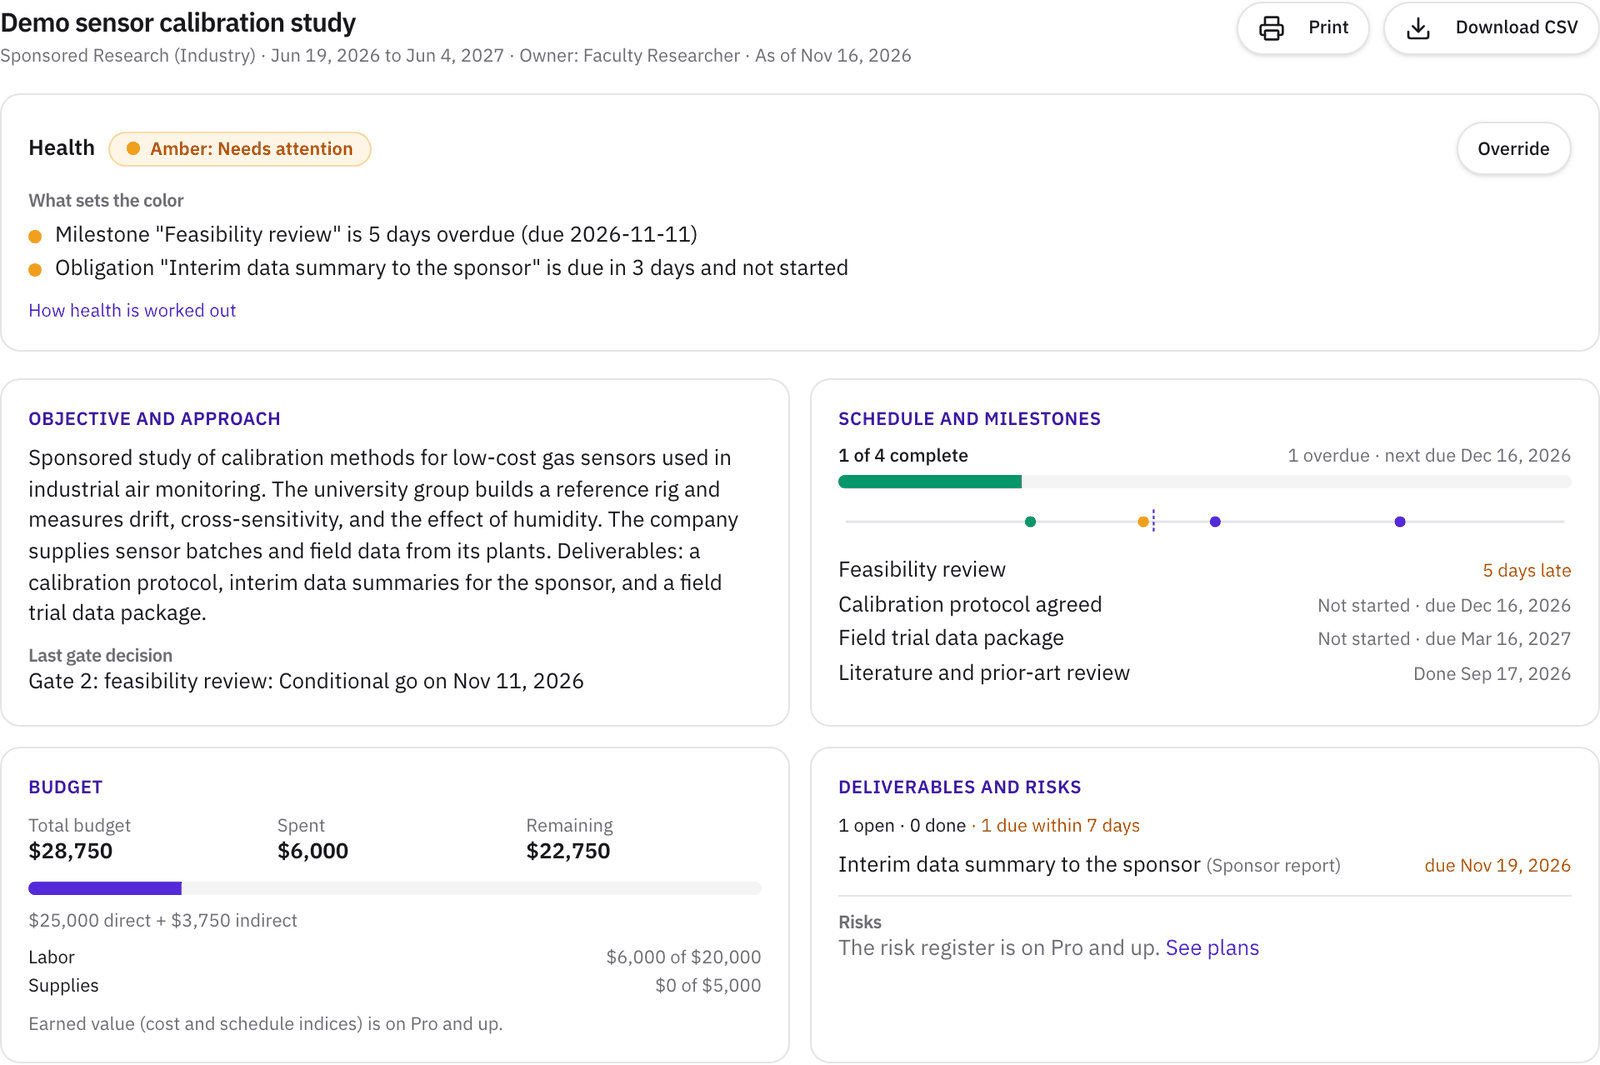
- Budget: the total, what's been spent, and what's left, split into direct and indirect costs and by category, with cost share beside it. Only the owner and admins see the figures. Everyone else sees "Budget: visible to project managers."
- Deliverables and risks: how many obligations are open, done, overdue, or due within 7 days, the next ones due, and on Pro the risks with the highest exposure that you can see.
The chart is live, so it always shows the project as it stands right now.
On Free, the same chart notes where a Pro feature would appear: the risk slot says the risk register is on Pro and up, and the budget quadrant says the same of earned value.
Step 2Read the health color and the facts that set it
Above the quadrants, the project's health color is Green (on track), Amber (needs attention), or Red (at risk). It's worked out from the project's own records by this rule.
Red if any of these is true:
- A milestone is more than 14 days overdue.
- An obligation is past its due date and still not started or in progress.
- The project is active, and a document it requires (NDA, IRB approval, or contract) isn't recorded or has expired.
- On Pro: a risk shared with all project members, and not closed, has an exposure of 20 or more.
- On Pro: the cost index or the schedule index is below 0.85 (step 6 explains both).
Amber if nothing is red and any of these is true:
- A milestone is 1 to 14 days overdue.
- An obligation is due within 7 days and hasn't been started.
- A recorded document expires within 30 days.
- Nothing has happened on the project for 30 days. A project less than 30 days old is exempt.
- On Pro: a risk shared with all members has an exposure of 15 to 19.
- On Pro: the cost index or the schedule index is from 0.85 up to 0.95.
Green otherwise.
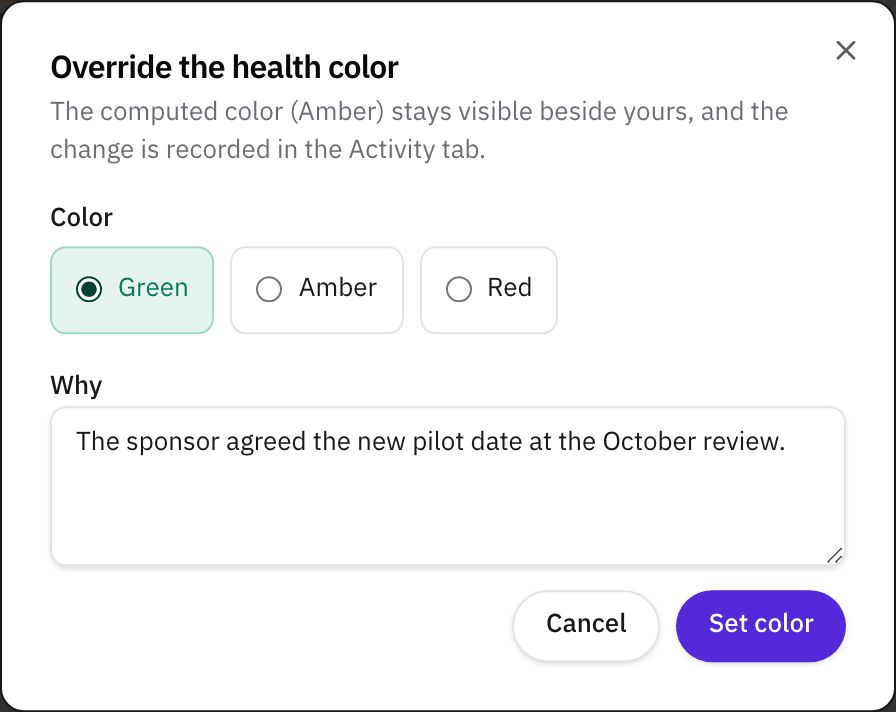
Under the color, What sets the color lists each fact behind it, red ones first, up to five of each kind. Days are counted in UTC. Completed and archived projects have no color. "On Pro" means the owner's plan, and only risks shared with every member count, so a private risk never changes the color the whole project sees. We may adjust these thresholds as real projects use them, and the app's own help always shows the rule in use.
The owner or an admin can set the color by hand. Click Override, pick a color, and say why in the note, which is required. The computed color stays visible beside yours, and the change is recorded in the project's Activity tab. Use the computed color removes the override.
Step 3Print the chart or download the project as a CSV
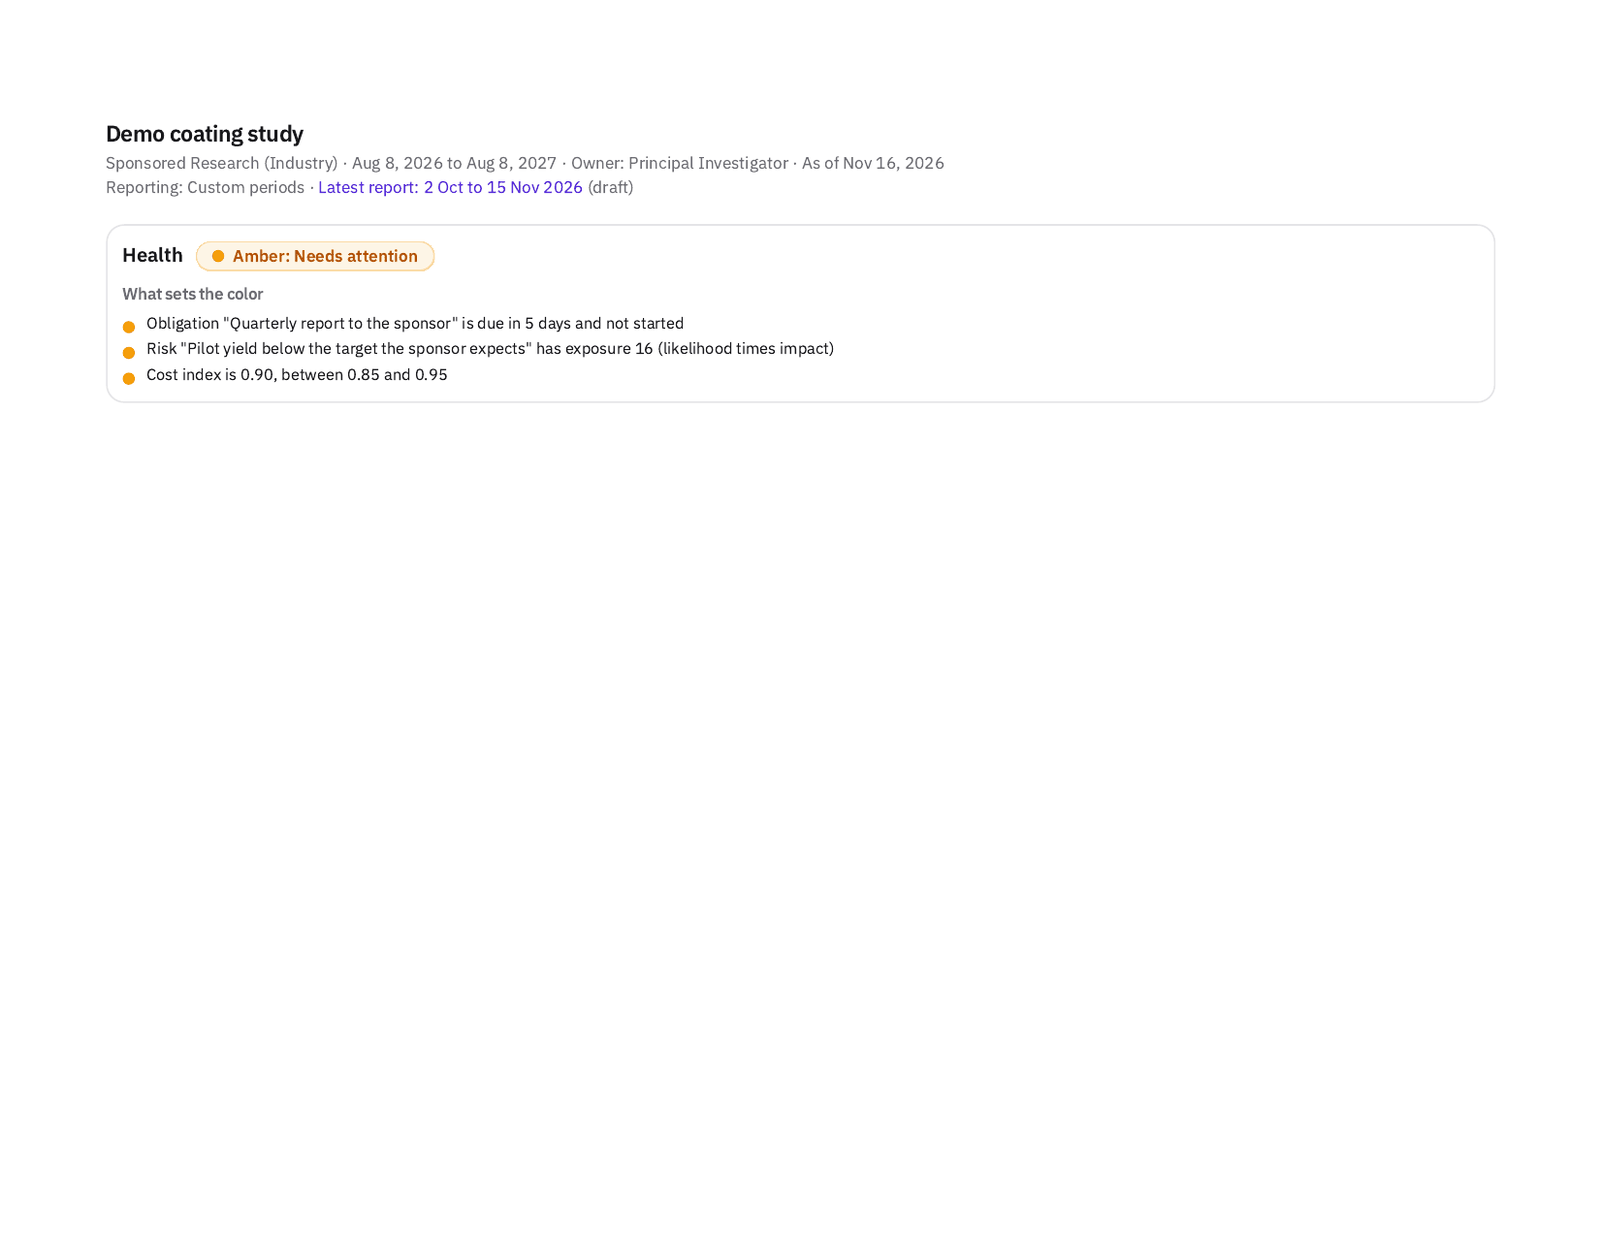
Print prints the quad chart on a single page, turned sideways, without the rest of the app. Choose "Save as PDF" in your browser's print dialog to send it as a file.
Download CSV saves the whole project as one spreadsheet file: every milestone with its checklist items, and every obligation. For the owner and admins, it also holds the budget lines. A Type column marks each row as a milestone, a checklist item, an obligation, or a budget line, so a filter shows one kind at a time. Both work for every member, on every plan.
Step 4Set the reporting periods
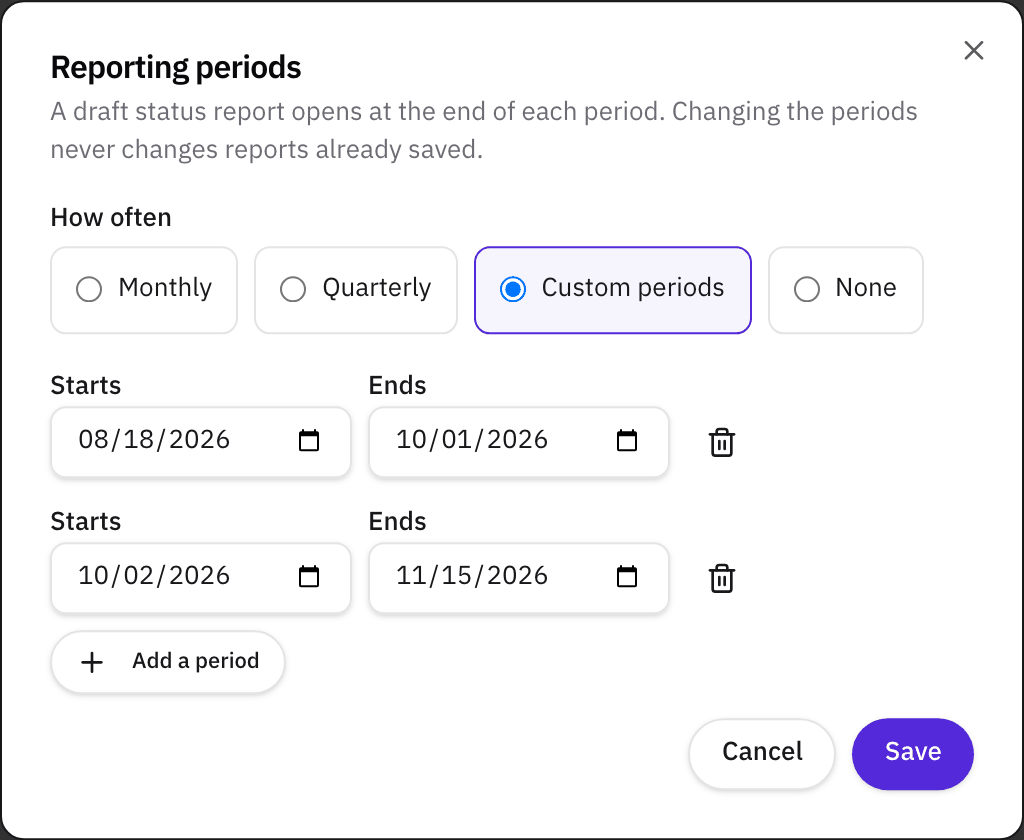
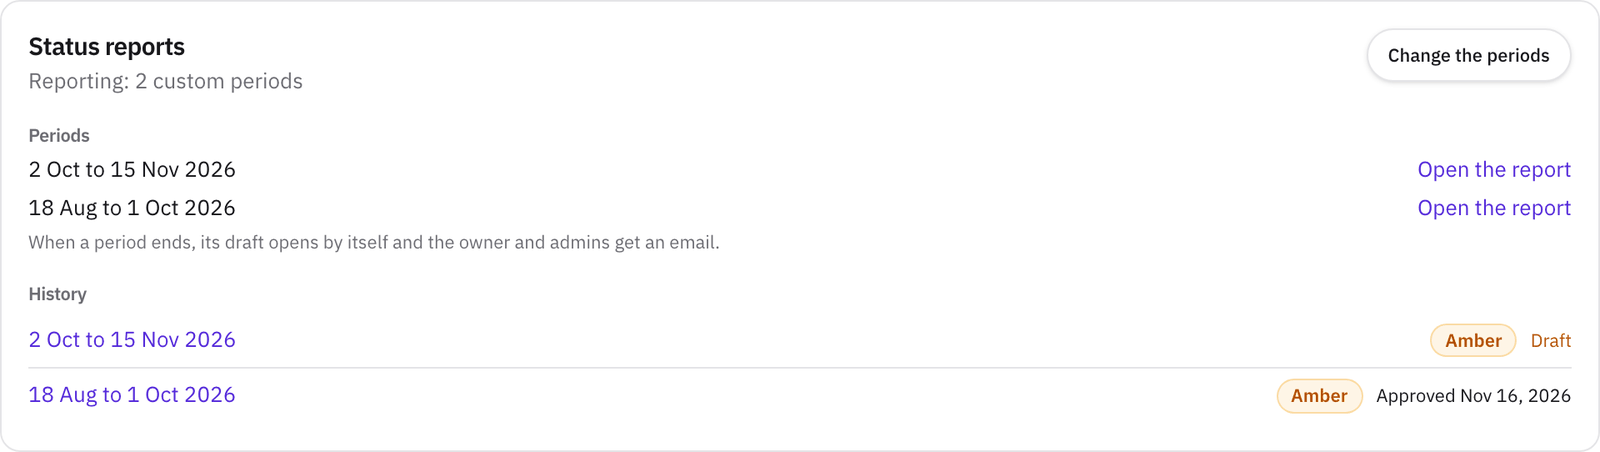
At the bottom of the Reports tab, the Status reports panel shows the project's reporting rhythm. The owner or an admin clicks Set reporting periods (or Change the periods) and picks Monthly, Quarterly, Custom periods (up to 40, each with its own start and end), or None. Monthly and quarterly periods start on the date in First period starts, which defaults to the project's start date. A project created from a template starts with the template's cadence. Changing the periods never changes a report that's already saved.
Setting the periods works on every plan, and the cadence also labels the project's Obligations card. On Free, the panel says that saved reports are part of Pro.
Step 5On Pro, write, approve, and correct a status report
A saved status report is the quad chart as it stood on the last day of a period, plus a narrative drafted from the project's records. On Pro (the owner's plan), it works like this:
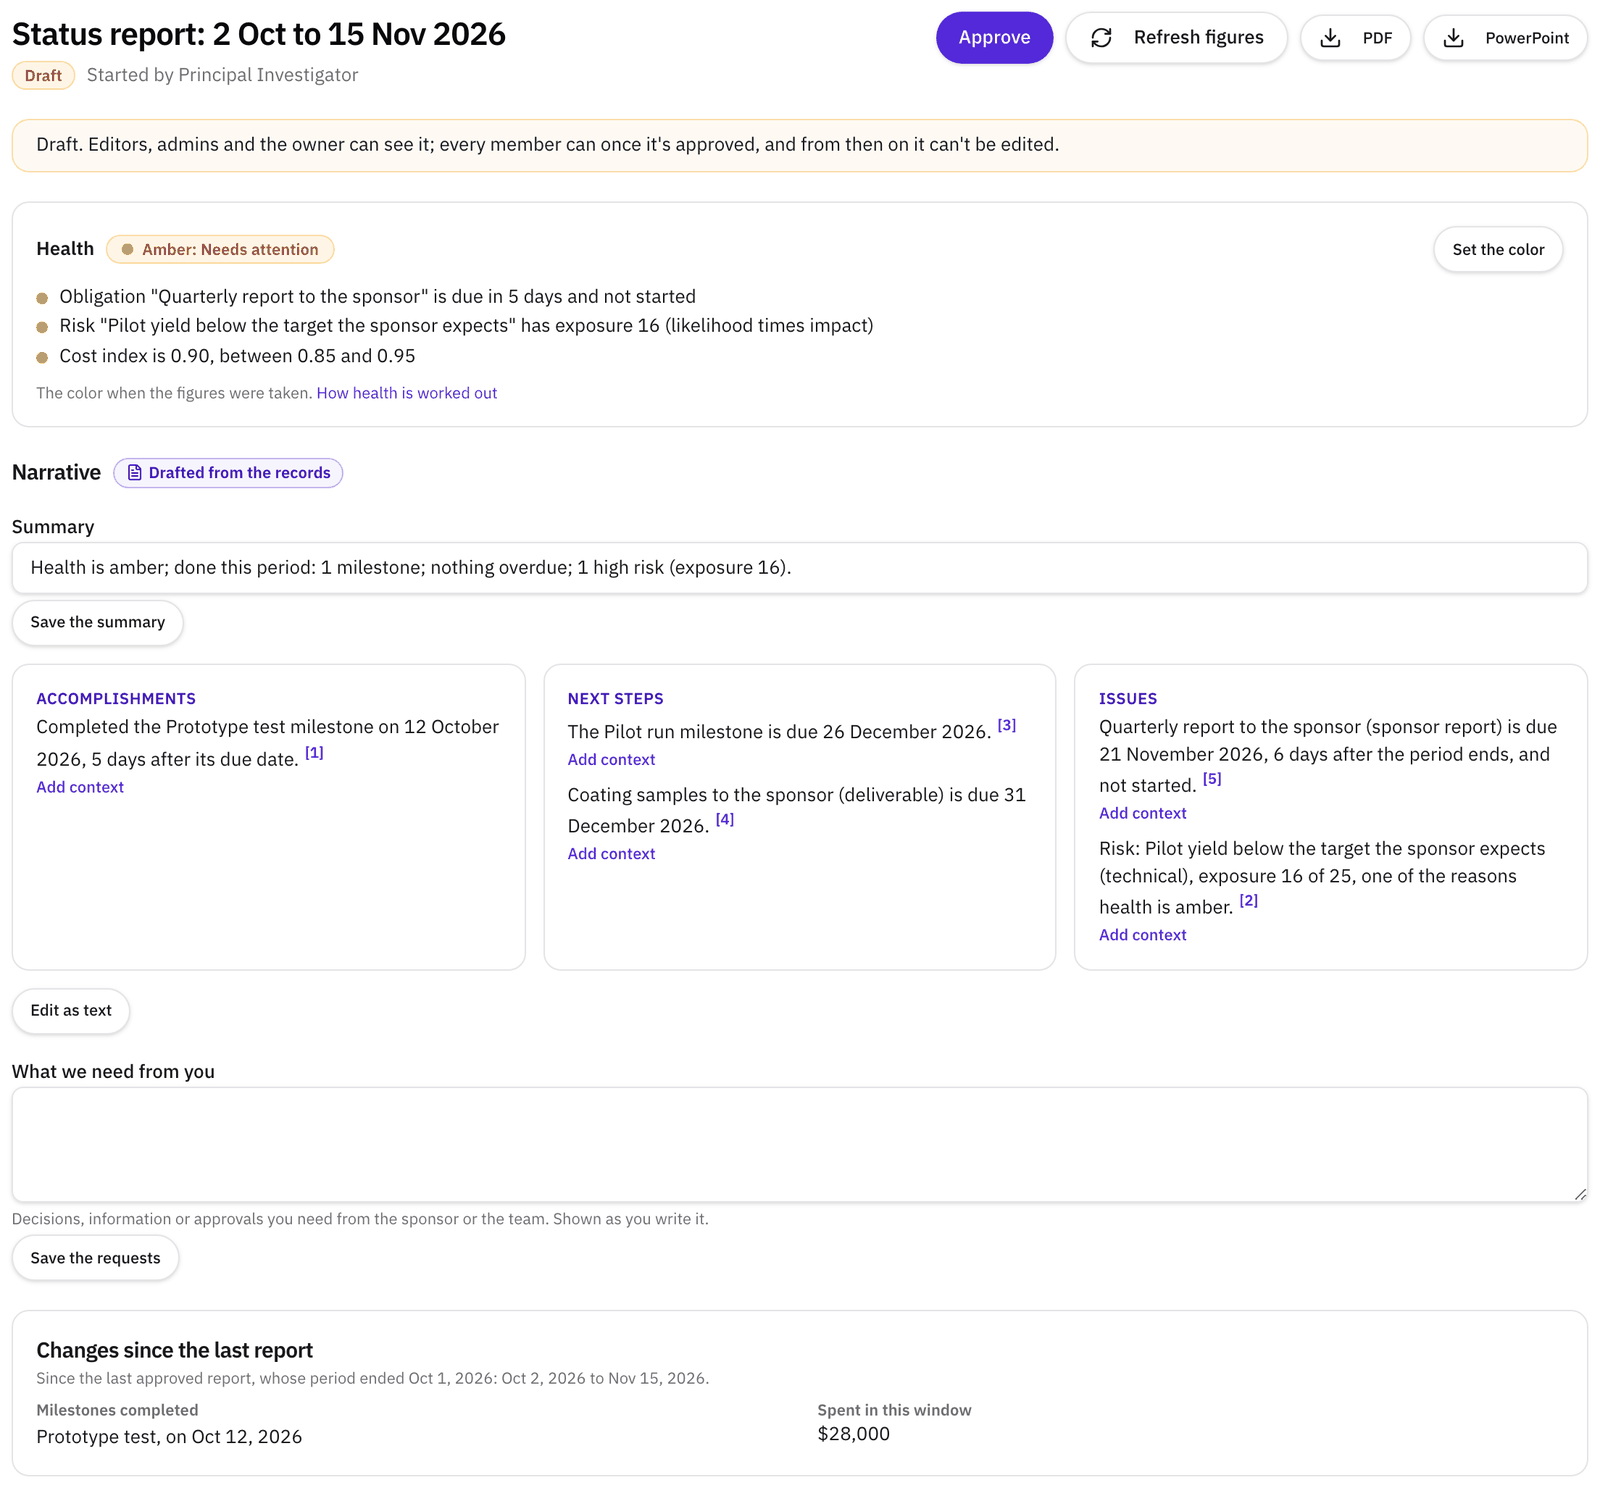
- The draft opens by itself. The day after a period ends, a draft report opens with that period's figures, and the owner and each admin get an email saying it's ready. The email follows Project deadline reminders in your notification settings. An editor, an admin, or the owner can also click Start the report for the current period or one of the last four.
- Read the drafted narrative. The draft is already written from the project's records: a one-line summary of the period, then Accomplishments, Next steps, and Issues. Each item shows its sources, so hover over or tap its number to see the record it came from. The draft uses only what every member can see, so it never shows budget figures or private risks.
- Add the context only you know. The records say what happened, and you know why. Under any item, click Add context and write a sentence or two, such as why a milestone slipped. It appears under the item exactly as you write it, so write it the way the sponsor will read it. Under What we need from you, list the decisions or approvals you need from the sponsor or the team.
- Rewrite it if you'd rather. Edit as text turns the narrative into three sections you can rewrite freely. Once you change the text it's yours, and refreshing the figures never overwrites it. Start again from the records brings back a fresh draft and keeps your context and your requests. Refresh figures retakes the period's figures, for example after spending was entered late.
- Check what changed. Changes since the last report lists the milestones completed and the milestones that slipped further past their baseline date. It also lists the obligations added and done, and the risks opened and closed that are shared with every member. The owner and admins also see what was spent.
- Set the report's own color, if needed. The owner or an admin can set the report's health color with a note, as on the live chart. The computed color stays beside it.
- Approve it. The owner or an admin clicks Approve. Every member can read an approved report, and nobody can edit it.
- Correct it. If an approved report was wrong, Start a correction opens the next version of the same report as a draft. Approving it replaces the old one, which stays in the history marked Superseded.
Drafts are visible to editors, admins, and the owner. The History list shows every report with its period, its health color, and whether it's a draft, approved, or superseded. If the owner moves to Free, the reports already saved stay readable.
Step 6On Pro, read the earned value
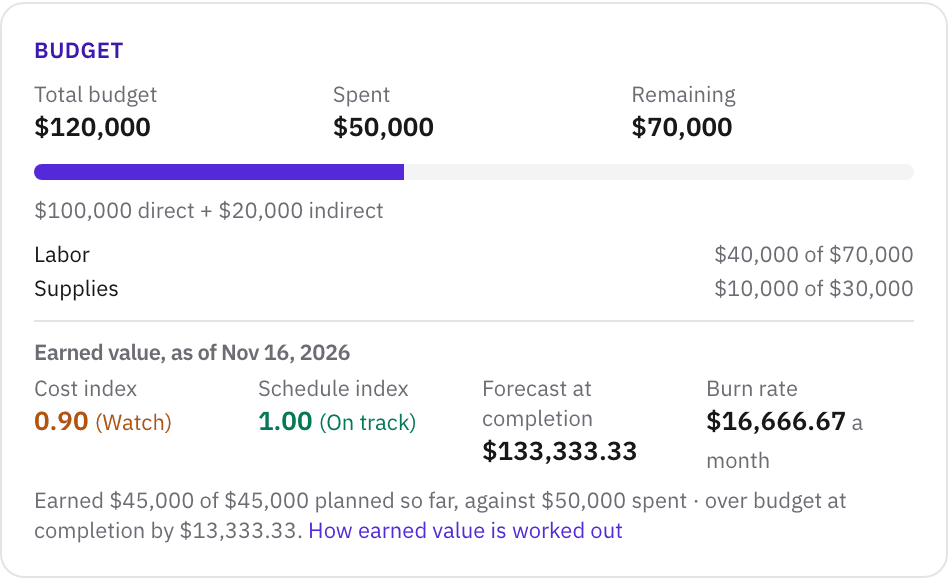
Earned value answers two questions with one number each: are we getting the work done for what we're spending, and are we on schedule? On Pro, the owner and admins see it in the budget quadrant of the live chart and of each saved report.
The idea comes from federal project control. The Federal Acquisition Regulation requires an earned value management system, built to the EIA-748 standard, on major federal development contracts (FAR 34.201). Ours is a light version that uses the standard's core measures on your project's own records. It isn't a certified system. Here's how it's worked out:
- Budget at completion is the project's total budget, direct plus indirect costs. Cost share isn't included.
- Each milestone is worth part of the budget. A payment milestone is worth its payment. The rest of the budget is split among the other milestones by their weight, and a milestone with no weight counts as 1. Weights are set on Pro, under More options on a milestone. Canceled milestones don't count.
- Planned value is the worth of the milestones the latest baseline said would be done by now.
- Earned value is the worth of the milestones actually completed by now.
- Actual cost is the spending recorded so far, without cost share.
- Cost index is earned value divided by actual cost. Above 1 means the work done cost less than its share of the budget.
- Schedule index is earned value divided by planned value. Above 1 means you're ahead of the baseline.
- Forecast at completion is the budget divided by the cost index: what the project will cost if spending continues at this rate.
- Burn rate is the average spending a month over the last 90 days, or since the project started if that's sooner.
The two indices and the forecast use the same formulas as the Department of Energy's one-page earned value reference, which also notes that an index above 1.0 is favorable (DOE EVMS Gold Card, 2019). Each index shows a label: On track from 0.95, Watch from 0.85 up to 0.95, and Behind below 0.85. An index reads Not yet measurable until there's something to divide by, such as a budget, recorded spending, or a baseline. Set a baseline on the Milestones tab to measure the schedule.
An example. A project's budget is $120,000: $100,000 direct and $20,000 indirect. It has three milestones: a kickoff payment of $20,000, a prototype test with no weight, and a pilot run with a weight of 3. The other $100,000 splits 1 to 3, so the prototype test is worth $25,000 and the pilot run $75,000. The baseline planned the kickoff and the prototype test by now, so planned value is $45,000. Both are done, so earned value is also $45,000. With $50,000 spent, the cost index is 0.90 (Watch). The schedule index is 1.00 (On track). The forecast at completion is $133,333. The project's health color turns amber, with the reason "Cost index is 0.90, between 0.85 and 0.95."
Every member sees the health color and its reasons, and a reason can name an index, because an index is a ratio, never an amount. The dollar figures stay with the owner and admins.
Step 7On Pro, export a report as a PDF or a PowerPoint slide
On any saved report, click PDF for a one-page PDF or PowerPoint for a one-slide presentation. Both carry the health color and its reasons, the narrative, the four quadrants, and the changes since the last report. A draft is stamped DRAFT across the top. A member who isn't the owner or an admin gets a version without the budget figures. A report already saved stays downloadable by anyone who can read it, whatever the owner's plan.
Step 8On Pro, put project deadlines in your calendar
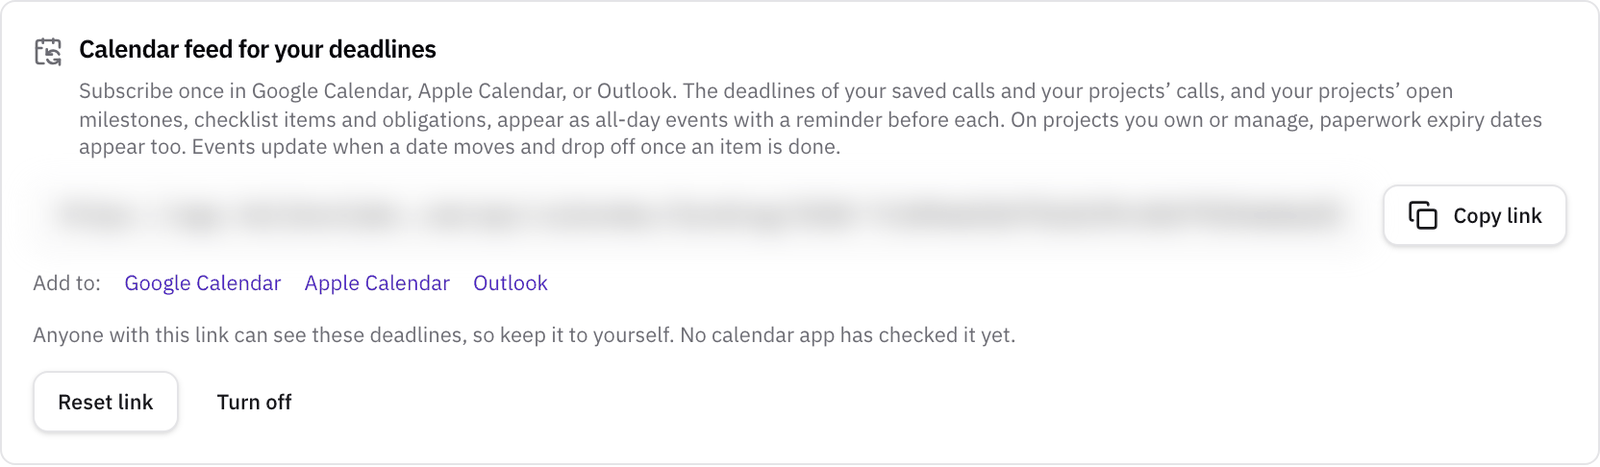
On Pro, a calendar feed keeps your project deadlines in Google Calendar, Apple Calendar, or Outlook. The feed follows your own plan, so every project you belong to that isn't completed or archived contributes, whatever its owner's plan. Open the Saved page and find Calendar feed for your deadlines. Click Turn on, then Copy link or one of the Add to links.
The feed carries your projects' open milestones, checklist items, and obligations, as all-day events with a reminder before each. On projects you own or manage, it also carries the dates required paperwork expires. It carries the deadlines of your saved funding calls and your projects' calls too. Events update when a date moves and drop off once an item is done.
Anyone with the link can see these deadlines, so keep it to yourself. Reset link issues a new one and stops the old one working.
What to do next
- Agree the reporting rhythm with your partner. Our guide How to manage a university-industry research collaboration covers meeting cadence and status reporting, and the free Governance Charter records what you agree.
- Record the decisions your reviews make. How to run a phase-gate review covers the five decisions and the record each leaves.
- Keep the inputs current. The chart is only as current as the project's records. How to track deliverables and reporting obligations and How to track a research project budget cover the obligations and the spending it reads.
Sources
- NASA Earth Science Technology Office, InVEST-20 reporting requirements (quad chart, section 7.1). esto.nasa.gov/files/solicitations/InVEST_20/InVEST_Reporting_Requirements.pdf
- Defense Advanced Research Projects Agency, Small business resources: Technical Summary Quad Chart Template. www.darpa.mil/work-with-us/communities/small-business/resources
- Federal Acquisition Regulation, 48 CFR 34.201, Earned value management system: policy. www.acquisition.gov/far/34.201
- U.S. Department of Energy, Office of Project Management, 2019, EVMS Gold Card. www.energy.gov/sites/default/files/2022-06/DOE%20EVMS%20Gold%20Card%20%2820190710%29.pdf
Related
- GuideHow to manage a university-industry research collaboration: the plain guide
- GlossarySteering committee
- GlossaryProject manager (research and development)
- GlossaryMilestone
- GlossaryIndirect costs (F&A)
- WalkthroughManage an R&D collaboration project: schedule, obligations, budget, and status reports
- HelpKeep a risk register for a research project
- HelpRun a phase-gate review and record the decision
- HelpHow to plan a research project schedule
- PagePricing
- GlossaryAlliance manager
- GlossaryDecision rights
- GlossaryEscalation protocol